Knee in the Curve
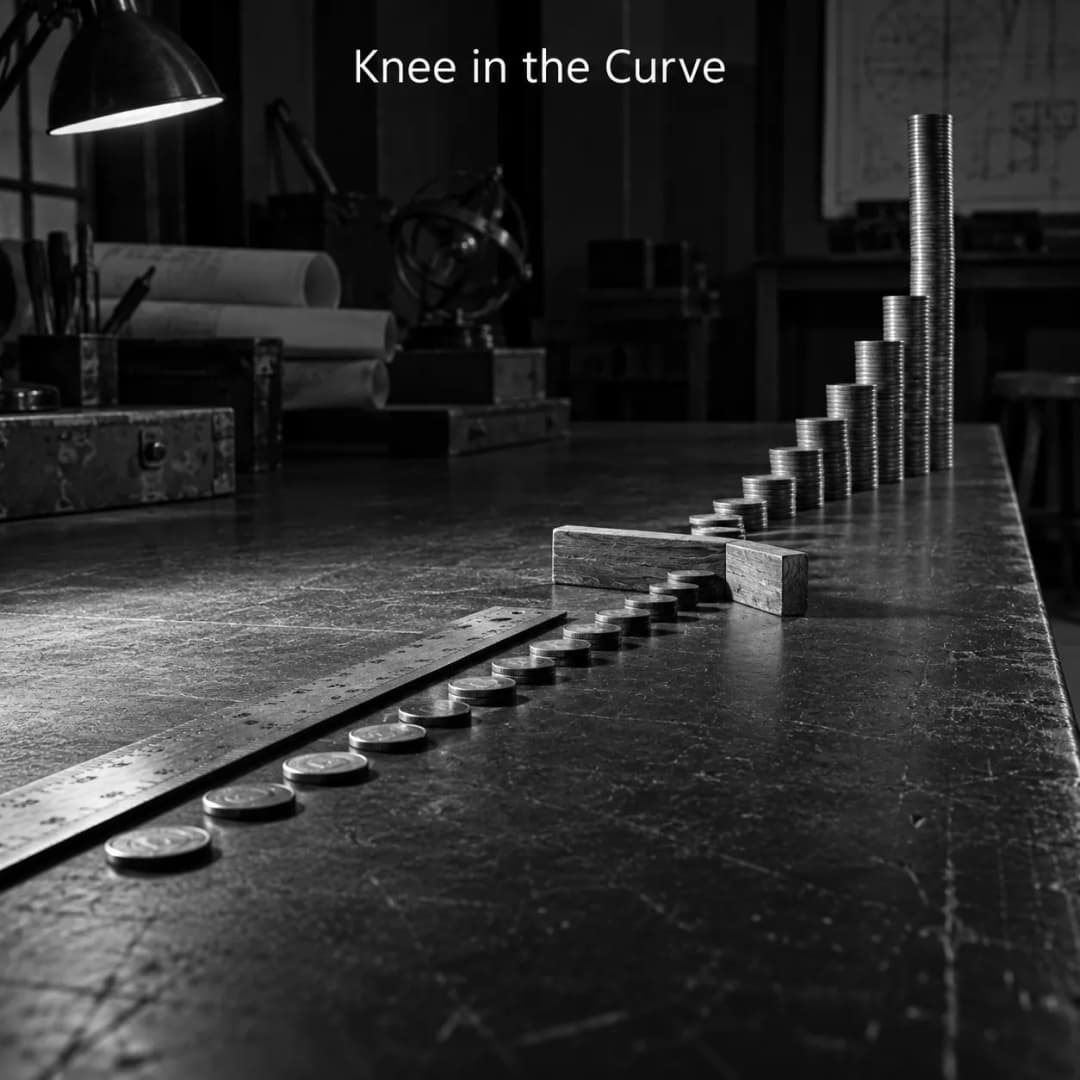
The knee in the curve is the inflection point on a nonlinear curve, where values that have been changing slowly begin to change fast. The phrase is standard engineering usage, and Hasard Lee employs it as an organising idea in The Art of Clear Thinking. It is not a research claim, and the chapter around it makes two attributions this page corrects. What survives is a way of noticing when experience has stopped being a guide.
What it is
Before the knee, a curve looks flat, and everything a person has seen so far says nothing much is happening. After it, that experience is worthless. The practical consequence is that anyone reasoning from what they have observed to date is reasoning from the flat part, and the flat part contains almost none of the information.
The demonstration Lee uses is the penny that doubles daily for a month. By the end it is worth many millions. Twenty days in, two-thirds of the way through, it is worth a few tens of thousands, well under one per cent of the final total. That day-twenty figure is the entire point: most of the way through, the flat part still looks like the whole story.
The two countermeasures Lee offers are worth more than the concept itself, and neither requires knowing where the knee is. Graph the data, because a curve is visible where a table is not. And use extreme data points, because any curve looks linear when you zoom in far enough.
In effect
Where this bites is forecasting from a short run of observations, which is most forecasting. Early adoption curves, compounding costs, infection counts and the accumulation of technical debt all spend a long time in the flat region and then do not. An organisation whose planning horizon fits inside the flat part will be confidently wrong in a specific direction.
Two attributions in the surrounding chapter need correcting, and they are the reason this page is careful. The chapter asserts that decades of research in cognitive psychology show that human brains struggle with nonlinear relationships, and supplies no researcher, no study and no endnote for it. There is a real literature on linear bias and on exponential growth bias, and it should be cited directly rather than through that sentence.
The second is a miles-per-gallon puzzle presented as the author's own worked example. It is the published fuel-efficiency illusion described by Richard Larrick and Jack Soll, and neither name appears anywhere in that book's bibliography. Credit belongs to them.
What it does not say
It does not say where the knee is. Nothing in the concept identifies the inflection point in advance, which is why the countermeasures are about visualisation rather than prediction.
It does not say that every slow-moving trend is about to accelerate. Plenty of flat lines are simply flat, and treating the concept as a general licence to expect an explosion is the mirror-image error.
It does not come with evidence that people are bad at this. The claim is plausible and there is a literature supporting something like it, and the source this page draws on cites none of it.
And the phrase is not a coinage. It is standard usage in engineering, and the page records it as a label rather than a contribution.
Sources
- Lee, H. (2023). The Art of Clear Thinking. The term and the doubling-penny figure at p. 49, reused at p. 62; the two countermeasures at pp. 70-71; the unsourced "decades of research" claim at p. 48; the miles-per-gallon puzzle at pp. 48-49.
- Larrick, R. P., & Soll, J. B. The published fuel-efficiency illusion, presented in that book as the author's own example. Neither author appears in its bibliography.
- Evidence grade: not a research claim. For the underlying effect, cite the linear bias and exponential growth bias literatures directly.