Index of Performance
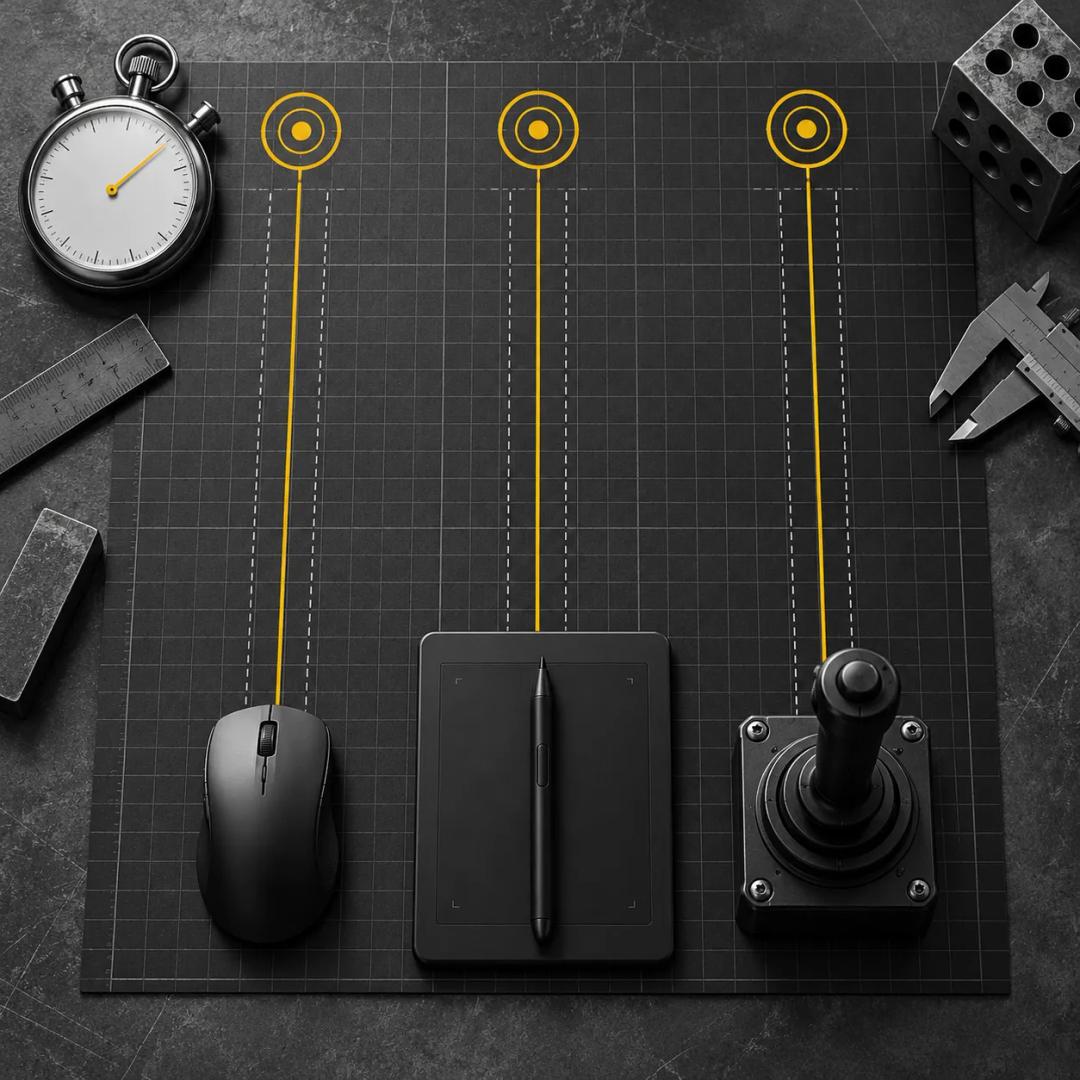
The index of performance is the rate measure Paul Fitts introduced in 1954 for movement tasks: the difficulty of a movement in bits divided by the average time it takes, expressed in bits per second. It gave researchers one number for comparing tasks and, later, pointing devices.
What it is
In his 1954 paper in the Journal of Experimental Psychology, Fitts defined the difficulty of a movement in bits per response from the ratio of its amplitude to the tolerance, which is the width of the target. He then divided that difficulty by the average movement time to obtain a performance index in bits per second. The measure came from the application of ideas from communication engineering to the motor system, with the movement treated as a message and the human motor system as a channel with a limited capacity.
Fitts's thesis was that this rate stays roughly constant as difficulty changes. His data supported the idea across a central range of amplitudes and tolerances in three tasks, reciprocal tapping, disc transfer and pin transfer, and the rate fell off outside that range. The best performance across the three tasks was about ten to twelve bits per second.
The tasks were chosen to vary amplitude and tolerance systematically. In reciprocal tapping, sixteen right-handed college men struck two target plates alternately with a stylus at amplitudes from two to sixteen inches and widths from a quarter of an inch to two inches. A different group of sixteen men did the disc transfer task, and twenty students, ten men and ten women, did the pin transfer task, with errors not permitted in both transfer tasks. Each combination of amplitude and tolerance produced a difficulty in bits and an average movement time, and dividing one by the other gave a rate for that combination.
I. Scott MacKenzie's 1992 paper in Human-Computer Interaction describes the index in terms of its place in the information-theoretic analogy. The index is analogous to channel capacity. A constant rate implies a linear relationship between movement time and difficulty, and the index is the reciprocal of the slope of the fitted regression line, so the two descriptions of the same data are linked. MacKenzie also notes that the way the index is calculated matters: computing it directly as difficulty divided by movement time gives different values from computing it through a regression that includes an intercept.
In effect
Once the law was applied to computing, the index became a way to put devices on one scale. In the 1978 comparison by Stuart Card, William English and Betty Burr, positioning times for the mouse and the rate-controlled joystick fitted Fitts's law, and the slope for the mouse was close to values found in other eye-hand tasks. The authors took this as a suggestion that the mouse's positioning time was near the minimum achievable. Key-based devices fell outside the scale because their positioning time was proportional to the number of keystrokes.
MacKenzie's review of six pointing studies shows the other side of the measure. The studies covered mice, trackballs, joysticks, touchpads, helmet-mounted sights and eye trackers, and their performance measures varied enormously. The paper concludes that this made cross-study comparison difficult and lists sources of experimental variation that might account for the spread. A figure reported for one device therefore carries information about the procedure as well as the device.
A 2004 review by R. William Soukoreff and MacKenzie, titled Towards a standard for pointing device evaluation, addresses the same concern through its title: it looks across 27 years of Fitts's law research in human-computer interaction with a view to making device evaluations comparable.
What it does not say
The index is a summary of how a movement task behaved in a given procedure. In Fitts's 1954 tasks it stayed roughly constant only across a central range of amplitudes and tolerances. MacKenzie's paper shows that the value depends on how it is calculated and on the way the experiment is run, so two reported figures are comparable only when their procedures match.
The index does not say how well a device suits a particular job. The 1978 comparison measured text selection on a display, and its finding that the mouse was fastest applies to that task and those devices.
Sources
- Fitts, P. M. (1954). “The information capacity of the human motor system in controlling the amplitude of movement.” Journal of Experimental Psychology, 47(6), 381-391. doi:10.1037/h0055392
- Card, S. K., English, W. K., & Burr, B. J. (1978). “Evaluation of mouse, rate-controlled isometric joystick, step keys, and text keys for text selection on a CRT.” Ergonomics, 21(8), 601-613. doi:10.1080/00140137808931762
- MacKenzie, I. S. (1992). “Fitts' law as a research and design tool in human-computer interaction.” Human-Computer Interaction, 7(1), 91-139. doi:10.1207/s15327051hci0701_3
- Soukoreff, R. W., & MacKenzie, I. S. (2004). “Towards a standard for pointing device evaluation, perspectives on 27 years of Fitts' law research in HCI.” International Journal of Human-Computer Studies, 61(6), 751-789. doi:10.1016/j.ijhcs.2004.09.001