The Compromise Effect on the Wine List
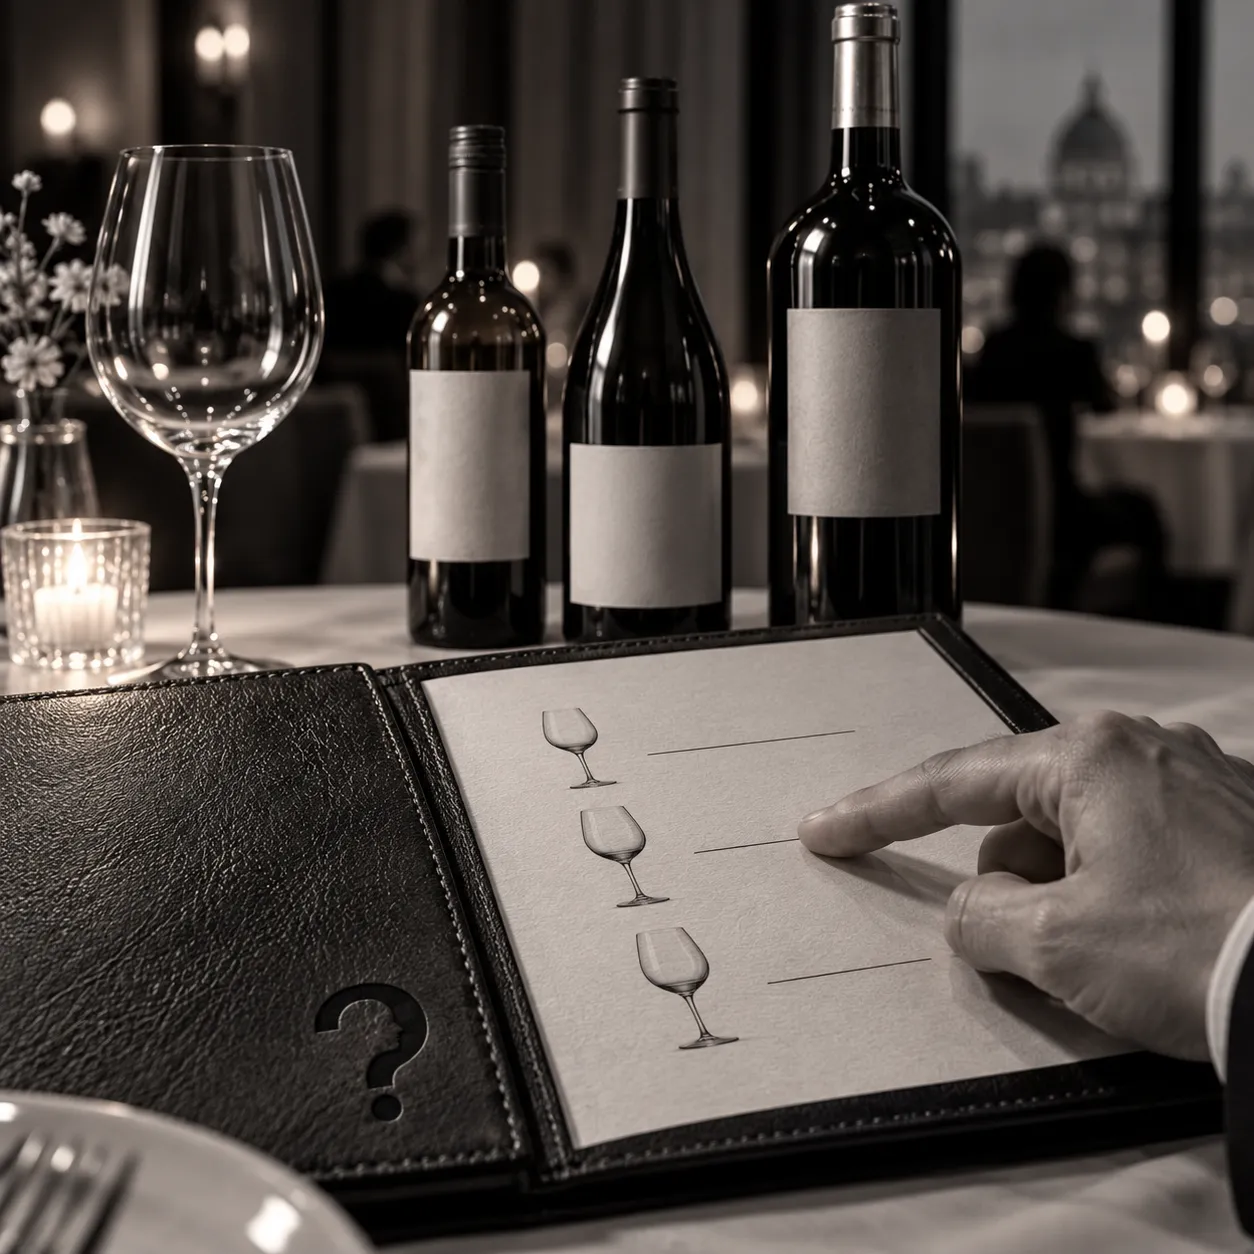
Adding a dear flagship can make the model beside it the bestseller. On London wine lists, the fattest percentage margins sit in the mid-range, not on the second-cheapest bottle.
Answer to the question
Why do people usually pick the middle option?
Because the middle feels safest. When people are unsure how much quality they need, an option flanked by a cheaper and a dearer one looks like the defensible choice. In Simonson and Tversky's 1992 camera study, adding a $469.99 flagship lifted the mid-priced model to 57 per cent of choices, and a 2016 meta-analysis found the effect reliable but variable.
Key takeaways
- In Simonson and Tversky's 1992 study, two Minolta cameras split choices 50 to 50; adding a $469.99 flagship moved the mid-priced model to 57 per cent.
- A 2016 meta-analysis of 142 experimental observations found middle options chosen significantly more often, with the effect's size varying by up to three times its average across study designs.
- A 2021 analysis of 470 London wine lists found the second-cheapest bottle had a lower markup than the four above it; percentage markups peaked in the mid-range.
- A 2012 study found the compromise effect weaker when people made binding choices and paid real money, so a seller adding a top tier should expect a modest shift and measure it.
Restaurant lore holds that diners steer clear of the cheapest bottle on a wine list, order the second cheapest so as not to look mean, and that restaurants know this and give that bottle their fattest markup. The story borrows its credibility from one of the sturdier findings in consumer research, about how people choose when a range of prices sits in front of them.
Do people pick the middle option in a price range?
Itamar Simonson named the compromise effect in the Journal of Consumer Research: put an option between two others on price and quality, and more people choose it because it sits in the middle. His explanation was about reasons rather than taste. When people are unsure what they want, they pick the option they can defend to themselves and to others.
His 1989 paper gave 372 students at three universities choices among televisions, apartments, calculators, mouthwash and other products, and rearranged the sets so that the same brand sometimes sat at an extreme and sometimes in the middle. In nine of eleven tests, a brand took a significantly larger share once it became the compromise. In a follow-up within the same paper, students judged that "while choosing a compromise is seen as safer, it is not perceived as easier to justify." The middle appeals because it limits how badly a choice can go.
In 1992 Simonson and Amos Tversky produced the best-known demonstration, with cameras. Offered a Minolta X-370 at $169.99 and a Maxxum 3000i at $239.99, a group of 106 people split 50 to 50. A second group of 115 saw the same two cameras plus a Maxxum 7000i at $469.99. Now 57 per cent chose the 3000i, 22 per cent the cheapest model and 21 per cent the new flagship. The authors called the tendency behind the compromise effect extremeness aversion: an option looks better when it sits between others and worse when it sits at either end.
A 2016 meta-analysis in the Journal of Consumer Psychology gathered 142 experimental observations and found that middle options were chosen significantly more often than the options around them. On this point the restaurant story stands. People do drift towards the middle of a range, and a dearer neighbour can make a mid-priced option look like the sensible one.
Is the second-cheapest wine on a restaurant list a trap?
The wine-list version is where the folklore outruns the data. Two economists, at the London School of Economics and the University of Sussex, collected the red and white wine lists of 235 London restaurants found on Tripadvisor in July 2015: 470 menus listing 6,335 wines. The second-cheapest bottle turned out to have a significantly lower markup than the four wines priced just above it. Their working paper concludes: "It is an urban myth that the second-cheapest wine is an especially bad buy."
What they did find sits closer to the compromise effect than the myth does. Percentage markups were highest on mid-range wines and lower on the two cheapest. The authors read this as ordinary profit-maximising pricing of a range that runs from basic to premium, and their data cannot show what diners ordered. A restaurant that earns most on the middle of its list, though, has every reason to want the middle to feel like the safe choice.
Real money also shrinks the effect. In a 2012 study in Marketing Letters, experienced shoppers made unforced choices between real brands, some hypothetical and some binding purchases they paid for. The compromise effect appeared in both settings, but it was "evidently not as strong when real payments are introduced in binding choice settings."
The 2016 meta-analysis found the same instability from another angle. The size of the effect varied by up to three times its average depending on how a study was designed. Choices framed as price against quality, and non-durable goods, tended to weaken it; descriptions without numbers and practical, utilitarian products tended to strengthen it. A wine list is a price-against-quality choice by construction.
The newest limit arrived in a Journal of Consumer Research paper published online in November 2025, with six studies and 9,377 participants. Most compromise research uses sets of two or three options. When people saw several options clustered at the extremes, they became relatively more likely to choose an extreme one, because the extremes now looked typical of the category. A long list with many cheap bottles and many grand ones is arguably closer to that set than to three Minolta cameras.
Where else does the middle option of a range win?
The strongest examples of the compromise effect share one feature: a buyer who cannot easily say how much quality they need, facing a short ladder of prices.
1. Cameras: a $469.99 flagship gave the middle model 57 per cent.
2. Simonson's 1989 tests: middle brands gained share in 9 of 11.
3. Fast-food drinks: adding a 44-ounce cup moved buyers up a size.
4. Durable goods: a 2016 study found the pull with real payments.
5. Sports betting: a 2012 analysis found extremeness aversion with real stakes.
6. Wine lists: 470 London lists show markups peaking mid-range.
The drinks case comes from a 2008 study with Duke University students. Dropping a 12-ounce cup and adding a 44-ounce one shifted choices upwards, and in the authors' simulation the average drink rose from 17.7 to 20.6 ounces. The wine case is weaker evidence for the compromise effect, since nobody in the London study recorded what diners ordered.
The drinks study had a direct effect on consumption. In the simulation, people's underlying preferences were held fixed. The menu changed, the middle moved, and people drank more. The authors went on to model how a cap on average serving size could cut consumption without a tax.
In the simulation, people's underlying preferences were held fixed.
A coffee bar that adds an extra-large cup may sell very few of them and still gain, if the old large now reads as the regular choice. The camera study showed the pull on price, and the drinks study showed it on quantity.
A coffee bar that adds an extra-large cup may sell very few of them and still gain, if the old large now reads as the regular choice.
How should a seller use the middle option in practice?
Richard Shotton's The Choice Factory (2018) turns the finding into advice. Its chapter on price relativity, Bias 9, pages 63 to 69, argues that nobody judges value in absolute terms, so a brand can change how good its value looks by changing what sits beside it. The academic anchor is the camera study, which the book cites as Tversky and Simonson, 1993, with 221 participants and 57 per cent against 22; the same figures first appeared in the 1992 paper with Simonson as first author.
The rest of the chapter rests on Shotton's own surveys, which appear in no journal. In one, a BMW looked better value to people who saw it beside a Bentley Flying Spur than to people who saw it beside a Ford Mondeo. His advice follows from both sources: add a high-end line so that the premium tier becomes the safe middle, and judge the move by the shift in the sales mix rather than by sales of the new top line.
The evidence on the compromise effect backs that advice, with one adjustment to expectations. The camera study used catalogue prices and business and psychology students answering a consumer survey. The 2012 study suggests a smaller pull when money changes hands, and the 2016 meta-analysis says price-against-quality choices are among the weaker settings. A seller adding a flagship should expect a modest shift in the mix and measure it, and should not count on the jump from half to 57 per cent.
A buyer can test the pull by asking which option they would take if the top one vanished. If the answer is the cheaper model, the range made the choice. The extra spend buys a feeling of safety.
Common questions
Why do people usually pick the middle option?
Because the middle feels safest. Itamar Simonson's 1989 studies of the compromise effect found brands gained share once they became the middle choice, and a 2016 meta-analysis of 142 experimental observations found middle options chosen significantly more often, though the size of the effect varied by up to three times its average with study design.
Is the second-cheapest wine a rip-off?
Not on the evidence from London. A 2021 analysis of 470 wine lists from 235 restaurants found the second-cheapest bottle had a significantly lower markup than the four wines above it, and percentage markups were highest on mid-range wines rather than the cheap end.
Does the compromise effect work when real money is spent?
Yes, but less strongly. A 2012 study in Marketing Letters found the compromise effect in both hypothetical and binding choices between real brands, though weaker once people paid real money, and the 2016 meta-analysis found price-against-quality choices tend to reduce it.
Sources
Simonson, I. (1989). 'Choice based on reasons: the case of attraction and compromise effects.' Journal of Consumer Research, 16(2), 158-174. doi:10.1086/209205. Full text read: 372 students at three universities in Study 1; compromise sets for televisions, apartments, calculator batteries, calculators and mouthwash; 9 of 11 compromise tests significant; Study 2 quotation 'while choosing a compromise is seen as safer, it is not perceived as easier to justify.'
Simonson, I., & Tversky, A. (1992). 'Choice in context: tradeoff contrast and extremeness aversion.' Journal of Marketing Research, 29(3), 281-295. doi:10.1177/002224379202900301. Full text read: Minolta X-370 at $169.99 and Maxxum 3000i at $239.99, n = 106, 50 and 50 per cent; with Maxxum 7000i at $469.99, n = 115, 22, 57 and 21 per cent.
Neumann, N., Böckenholt, U., & Sinha, A. (2016). 'A meta-analysis of extremeness aversion.' Journal of Consumer Psychology, 26(2), 193-212. doi:10.1016/j.jcps.2015.05.005. Abstract read: 142 experimental observations; middle options chosen significantly more often; variation up to three times the average magnitude; price-quality tradeoffs, nondurable categories and binary-trinary comparisons reduce it, non-numeric attributes and utilitarian products increase it.
de Meza, D., & Pathania, V. (2021). 'Is the second-cheapest wine a rip-off?' Economics Letters, 205, 109965. doi:10.1016/j.econlet.2021.109965. Full text read of the accepted version, AAWE Working Paper No. 264 (March 2021): 235 London restaurants from Tripadvisor, July 2015; 470 menus; 6,335 wines; second-cheapest markup significantly below the next four; percentage markups highest on mid-range wines.
Müller, H., Kroll, E. B., & Vogt, B. (2012). 'Do real payments really matter? A re-examination of the compromise effect in hypothetical and binding choice settings.' Marketing Letters, 23(1), 73-92. doi:10.1007/s11002-011-9137-2. Abstract read: experienced consumers, unforced choices between real brands; effect present in both frames and 'evidently not as strong when real payments are introduced in binding choice settings'.
Sharif, M. A., Webb, E. C., & Bhatia, S. (2026). 'Extremeness aversion and choice set composition: exposure to multiple extreme options reduces extremeness aversion.' Journal of Consumer Research, 53(2), 216-232. Published online 25 November 2025. doi:10.1093/jcr/ucaf061. Abstract read: six studies, total N = 9,377; more extreme choices when several extreme options are present, because extremes seem more typical of the category.
Lichters, M., Müller, H., Sarstedt, M., & Vogt, B. (2016). 'How durable are compromise effects?' Journal of Business Research, 69(10), 4056-4064. doi:10.1016/j.jbusres.2016.02.039. Abstract read: compromise effect found for durable goods with real branded products, real payments, pre-choice evaluation and a no-buy option.
Hwang, J. H. (2012). 'Extremeness aversion bias and learning behavior: evidence from the sports betting market.' SSRN working paper. doi:10.2139/ssrn.2081238. Abstract read: extremeness aversion bias found in a sports betting market in which real money is at stake.
Sharpe, K. M., Staelin, R., & Huber, J. (2008). 'Using extremeness aversion to fight obesity: policy implications of context dependent demand.' Journal of Consumer Research, 35(3), 406-422. doi:10.1086/587631. Full text read: 152 Duke University students in the validation study; low menu 12, 16, 21, 32 oz against high menu 16, 21, 32, 44 oz; simulated average consumption 17.7 oz against 20.6 oz; average-size standard modelled as a policy.
Shotton, R. (2018). The Choice Factory: 25 behavioural biases that influence what we buy. Harriman House. Read in full by this publication, with a reliability audit. Bias 9, Price Relativity, pp. 63 to 69; the camera study cited as Tversky and Simonson, 1993, at pp. 67 to 68; the BMW, PG Tips and King Cobra comparisons are the author's own unpublished tests.