What is reverse inference in neuroscience?
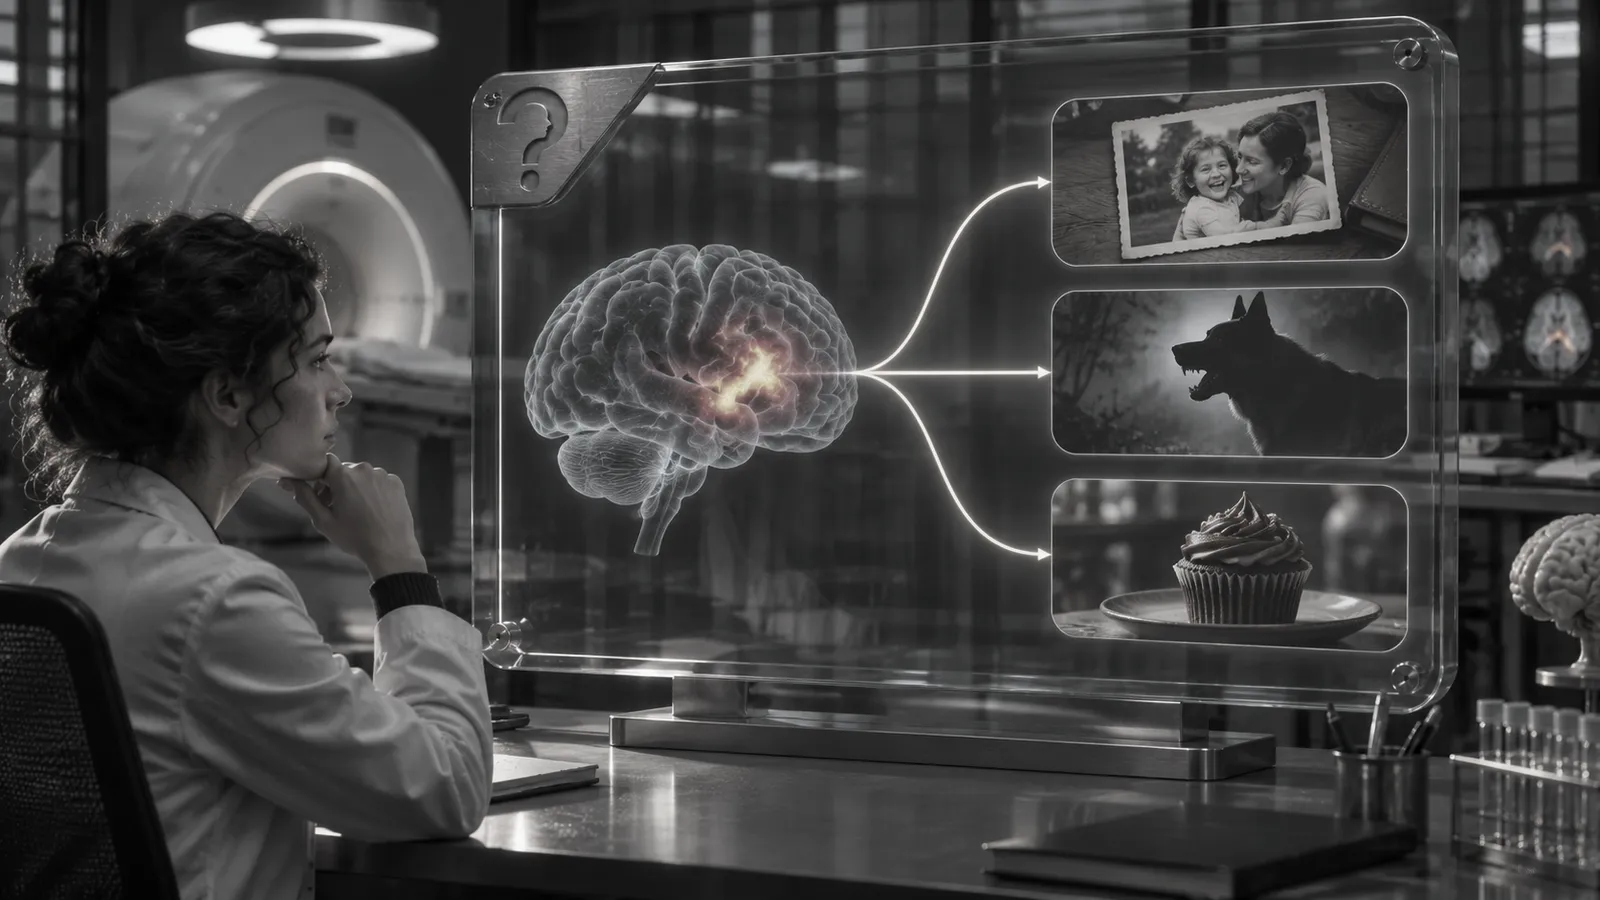
How a scan result becomes a claim about a feeling, why a region's selectivity decides the strength of that claim, and what large databases have added.
Answer to the question
What is reverse inference in neuroscience?
Reverse inference in neuroscience is the step from an active brain region to the mental process behind it, such as concluding a person felt pleasure because a region lit up. Russell Poldrack showed in 2006 that the step is only as strong as the region's selectivity, and large databases now let researchers measure it.
Key takeaways
- Reverse inference is the step from an active brain region to the mental process behind it; imaging studies normally run the other way, from a task to a map of activity.
- Russell Poldrack's 2006 analysis ties the strength of the step to selectivity: how often the region's activation reflects the process of interest compared with how often it appears for other tasks.
- Florian Hutzler's 2014 paper argues the step can be highly predictive when the task setting is added as a condition.
- In a large automated synthesis of 3,489 imaging studies, forward maps and reverse maps for emotion and working memory pointed to different regions (Yarkoni and colleagues, 2011).
- Decoding from whole-brain patterns recovered the type of task from single activation maps at better than chance, but could not separate closely related terms such as executive and working memory.
Imaging studies run in one direction: a researcher sets a task, scans people doing it and maps where the signal changed. Reverse inference runs the other way, from a region that became active to a conclusion about what the person was thinking or feeling.
The first direction is routine method. The second is a judgement, and much of the distance between a laboratory result and a headline about the brain sits inside it. Martin Lindstrom's Buyology popularised the hope that scans can reach reasons shoppers cannot put into words, and that hope pays off only if a pattern of activity can be turned back into a feeling or a preference.
Where What Is Neuromarketing? A Simple Guide for Business Owners asks what the method can answer for a business, the question here is narrower: what licenses a conclusion once the scan is done.
Where does reverse inference in neuroscience begin?
It begins with a forward result. The same wine, tasted at a higher stated price, was rated as more pleasant, and the scanner showed more activity in the medial orbitofrontal cortex. That is the finding of Hilke Plassmann and colleagues in 2008. Participants lay in a scanner and tasted wines they believed came from different sources and sold at different prices, although the wines were identical. Both the pleasantness ratings and the signal in that region rose with the stated price.
Price was changed, and activity followed. Nothing in that result says that activity in the region always means pleasure. What lets the authors link the two is the rating that rose alongside the signal, together with the wide view that this region encodes experienced pleasantness. Gaze records sidestep much of the problem for attention, because where the eye went is observed directly, as Eye Tracking in Neuromarketing: What Customers Really See describes. Feelings and preferences are what need the backward step.
Now run the arrow backwards. Suppose a new study reports activity in that same region and says shoppers found a product pleasant. Whether that follows depends on how often the region is active when people are not experiencing pleasantness. Russell Poldrack set this out in a 2006 paper in Trends in Cognitive Sciences, using Bayesian reasoning: the reliability of a reverse inference rests on the selectivity of the region, meaning how often its activation reflects the process of interest compared with how often it appears for other tasks.
Selectivity is a base rate in disguise. A region that responds in only a few kinds of task works like a fingerprint. A region that responds in many kinds works like a common name: hearing it tells you little about who is in the room.
The popular habit of assigning one feeling to one deep region is reverse inference in its simplest form, a theme in Is the Lizard Brain Real in Marketing. Buyology presents scanning as a route past stated reasons, and that route passes through the backward step each time a region is named for a feeling. The claim is as strong as the region's selectivity and the support around it.
When is a backward step allowed?
The step is not forbidden. Florian Hutzler argued in 2014 that the pessimistic view of reverse inference goes too far. His revised formulation adds the task setting as a condition. With it, he showed through an example involving estimation, reverse inference can be highly predictive, and its strength can be estimated from meta-analyses.
Region-level questions also sharpen when a region is split. The insula is active in a very wide range of studies, which has made its function hard to pin down. Luke Chang and colleagues combined a connectivity-based division of the insula with a large meta-analytic database and found three subregions: dorsoanterior, ventroanterior and posterior. Each was linked to a distinct function, and the dorsoanterior part was the most consistently tied to cognition.
Those papers suggest four questions to put to any claim that a scan revealed a feeling:
- How often is this region active across studies of other kinds?
- Does the task setting match the settings in which the link was established?
- Did a behavioural measure, such as a rating, move with the signal?
- Does a pattern across many regions, and not one region, carry the result?
How did databases turn selectivity into a number?
In 2011 Tal Yarkoni and colleagues released a framework that mines the text of published imaging papers, extracts reported activation coordinates automatically and pools them by term. The database in the paper held 100,953 activation points from 3,489 studies in 17 journals. For each term it could draw two maps: a forward map, showing where activity is likely given the term, and a reverse map, showing how likely the term is given activity at a location. The second map is a measured form of reverse inference.
The two maps differ in ways that matter. For emotion, frontal regions were consistently active in the forward map but not selective in the reverse map, where the amygdala and the ventromedial prefrontal cortex stood out. For working memory, the forward map highlighted the dorsolateral prefrontal cortex, the anterior insula and the dorsal medial frontal cortex, while the reverse map pointed to anterior prefrontal and posterior parietal cortex. Consistent activity and selective activity are different properties, and only the second supports a backward step.
The same system was also used to decode. Given 281 individual activation maps, 94 from working memory tasks, 108 from emotion tasks and 79 from pain tasks, the classifier recovered the task type with sensitivities of about 94, 70 and 65 per cent, where chance was 33 per cent. Across 25 frequently used terms, mean pairwise accuracy was about 72 per cent. The backward step held for broad categories, and closely related terms such as executive and working memory could not be separated above chance.
Common questions
What is reverse inference in neuroscience?
It is the step from an observed brain activation to a conclusion about the mental process behind it. Studies normally work forwards, from a task to a map of activity. Reverse inference goes backwards, from the map to the task or state, and its strength depends on how selective the active region is.
Is reverse inference always a mistake?
No. Poldrack's 2006 analysis ties its strength to the selectivity of the region, and Hutzler's 2014 paper argues it can be highly predictive when the task setting is taken into account. Pattern-based decoding across many studies supports it for broad categories.
What does selectivity mean for a brain region?
It is how much more often a region responds to one process than to others. A region active in many kinds of task tells a reader little about any single state, while a region active in few kinds tells a reader more.
Can a brain scan show what a shopper wants?
A scan can show activity that goes with a stimulus and, with a matching rating or choice, support a link to a state. A claim about wanting needs the four questions above, and broad categories hold up better than claims about a single region.
Sources
Lindstrom, M. Buyology. Seed book; vault hub Books/Buyology.
Poldrack, R. A. (2006). Can cognitive processes be inferred from neuroimaging data? Trends in Cognitive Sciences, 10(2), 59-63. doi:10.1016/j.tics.2005.12.004 https://doi.org/10.1016/j.tics.2005.12.004
Plassmann, H., O'Doherty, J., Shiv, B., & Rangel, A. (2008). Marketing actions can modulate neural representations of experienced pleasantness. Proceedings of the National Academy of Sciences, 105(3), 1050-1054. doi:10.1073/pnas.0706929105 https://doi.org/10.1073/pnas.0706929105
Hutzler, F. (2014). Reverse inference is not a fallacy per se: Cognitive processes can be inferred from functional imaging data. NeuroImage, 84, 1061-1069. doi:10.1016/j.neuroimage.2012.12.075 https://doi.org/10.1016/j.neuroimage.2012.12.075
Chang, L. J., Yarkoni, T., Khaw, M. W., & Sanfey, A. G. (2013). Decoding the role of the insula in human cognition: Functional parcellation and large-scale reverse inference. Cerebral Cortex, 23(3), 739-749. doi:10.1093/cercor/bhs065 https://doi.org/10.1093/cercor/bhs065
Yarkoni, T., Poldrack, R. A., Nichols, T. E., Van Essen, D. C., & Wager, T. D. (2011). Large-scale automated synthesis of human functional neuroimaging data. Nature Methods, 8(8), 665-670. doi:10.1038/nmeth.1635 https://doi.org/10.1038/nmeth.1635